If flow data tells you who talked, packet inspection tells you what happened. On a 10 Gbps link at 50% use, even 5 minutes of raw packets can hit nearly 200 GB. So I’d start with the lightest check first, then move deeper only when I still have gaps.
Here’s the short version:
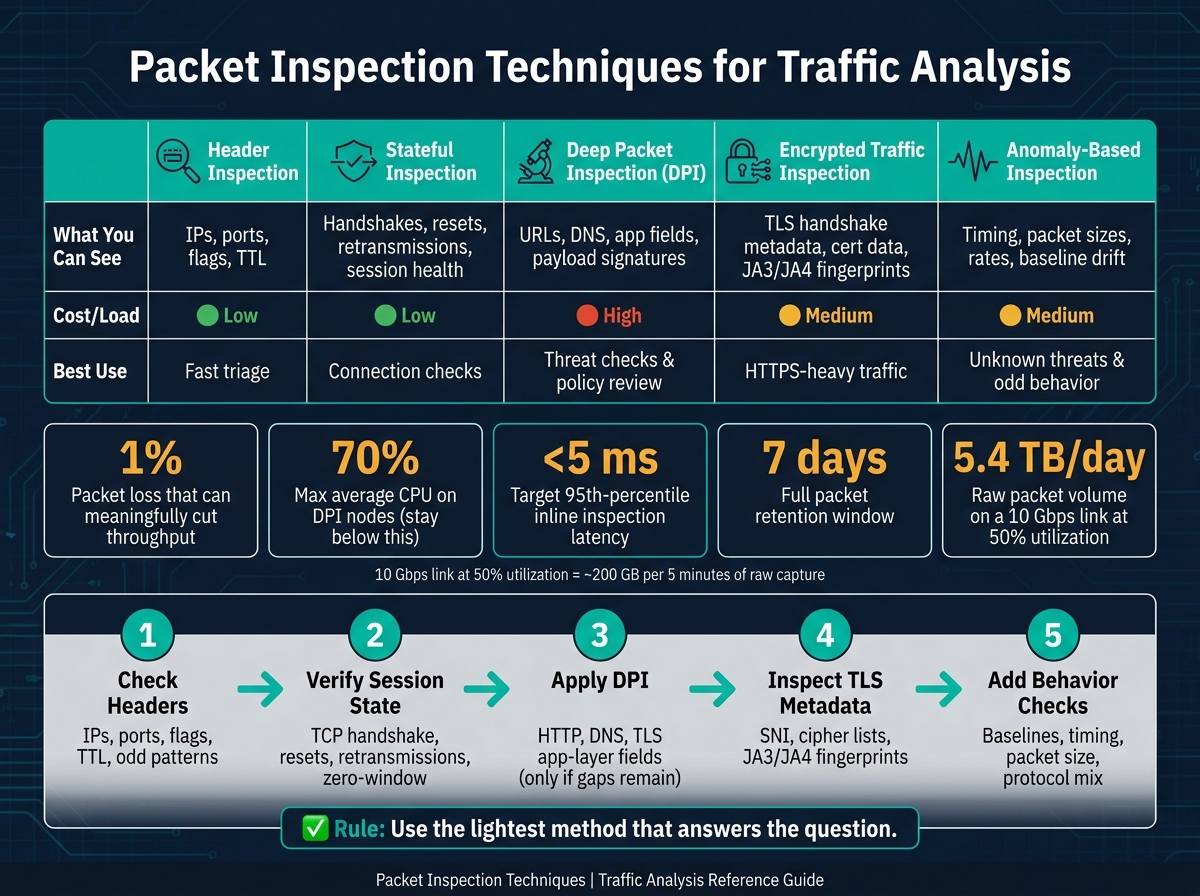
- I’d check headers first for IPs, ports, flags, TTL, and odd patterns
- Then I’d verify session state like the TCP handshake, resets, retransmissions, and zero-window events
- If that still isn’t enough, I’d use DPI to inspect app-layer data like HTTP, DNS, and TLS fields
- If the payload is hidden by HTTPS, I’d review TLS metadata such as SNI, cipher lists, and JA3/JA4
- To catch traffic that doesn’t match known rules, I’d add behavior-based checks using baselines, timing, packet size, and protocol mix
A few numbers matter right away:
- 1% packet loss can cut throughput in a meaningful way
- DPI nodes should stay under 70% CPU on average
- For inline inspection, target under 5 ms at the 95th percentile
- A common retention plan is 7 days for full packets and 90 days for headers only
- At 10 Gbps and 50% use, raw packet volume can reach about 5.4 TB per day
Packet Inspection Methods: Techniques, Visibility & Performance at a Glance
S29 - Network Traffic Analysis | Packet Inspection & Threat Detection in Cybersecurity
sbb-itb-645e3f7
Quick Comparison
| Method | What I can see | Cost/Load | Best use |
|---|---|---|---|
| Header inspection | IPs, ports, flags, TTL | Low | Fast triage |
| Stateful inspection | Handshakes, resets, retransmissions, session health | Low | Connection checks |
| DPI | URLs, DNS, app fields, payload signatures | High | Threat checks and policy review |
| Encrypted traffic inspection | TLS handshake metadata, cert data, fingerprints | Medium | HTTPS-heavy traffic |
| Anomaly-based inspection | Timing, packet sizes, rates, baseline drift | Medium | Unknown threats and odd behavior |
My main takeaway: use the lightest method that answers the question, keep packet loss low, sync clocks, and have a bypass path ready if deep inspection starts adding delay.
That approach keeps traffic analysis focused, fast, and easier to act on.
Checklist 1: Inspect Headers and Sessions First
Header and stateful inspection should be your first stop. They’re fast, light, and usually give you enough signal to tell whether traffic looks normal before you move into heavier analysis.
Header inspection checklist
Save captures as .pcapng so you keep metadata intact. Use .pcap only if you need compatibility with older tools. Set timestamps to UTC so they match cleanly with SIEM and EDR logs.
After the capture starts, zero in on the core fields that matter most:
- IP layer: source and destination addresses, TTL, Type of Service (TOS), and the Don't Fragment (DF) flag
- Transport layer: source and destination ports, protocol numbers (TCP = 6, UDP = 17, ICMP = 1), and TCP flags
There are a few checks worth doing right away.
- Use Statistics → Endpoints in Wireshark to spot the highest-volume IPs and ports
- Filter for non-standard ports like
tcp.port == 4444or5555. Those often show up with backdoors and remote access tools - Flag private IP addresses on public-facing links. That usually points to a routing problem or a bad config
- Flag repeated ICMP bursts within 1 ms. That can be a sign of flooding
For TCP flags, one pattern stands out fast: a large number of SYN packets from one source without matching ACKs usually points to a port scan.
If the headers look off, check session state before digging deeper.
Stateful inspection checklist
Stateful inspection tells you whether packets are part of a valid, properly established session.
Start with the three-way handshake: SYN → SYN-ACK → ACK. Compare the handshake timing to your baseline. In Wireshark, "SYN Retransmissions" in the Expert Information panel often point to firewall blocks or routing issues.
Track half-open sessions that never finish the handshake. Those can drain server resources and may point to a SYN flood or a scan. Also watch for repeated RST flags. Frequent resets can mean firewall interference, load balancer config issues, or services that aren’t responding. Don’t mix those up with normal FIN/ACK teardowns.
Keep an eye on TCP window size too. A zero window means the receiver is full, so the sender has to stop for a bit. That usually signals congestion or a host under strain. You can filter retransmissions with tcp.analysis.retransmission to measure how often it happens. Even 1% packet loss can cut throughput in a meaningful way.
Last, export session metadata such as byte counts, packet counts, and session duration as CSV or JSON with tools like Zeek or tshark. That output plugs straight into SIEM correlation and gives you a baseline to compare later.
Move to DPI only if headers and session state still don’t answer the question. If the session looks clean but the traffic still feels off, the next step is application-layer inspection.
Checklist 2: Use Deep Packet Inspection for Application and Content Visibility
When headers and session state still leave gaps, DPI is the next move. It lets you look at URLs, DNS names, and payload signatures. And if the application data is still hard to read, the next step is encrypted-traffic and anomaly-based inspection.
DPI configuration checklist
- Protocol decoding: Decode application-layer fields like HTTP URIs, DNS queries, and TLS SNI fields. Use protocol parsing and traffic-pattern heuristics to identify applications by both port and behavior.
- Detection rules: Use byte-pattern matching to catch known malware strings or policy violations. Parser-based rules are the better option than raw byte matching because they hold up better against evasion methods like URL encoding and packet fragmentation. Tools like Suricata are strong for security signature matching, while nDPI is useful for detailed application identification, so many production teams run both. Send DPI findings to IDS/IPS or SIEM platforms so they can trigger action, not just generate alerts.
- Performance and bypass controls: Keep CPU use on DPI nodes below 70% on average so the system can absorb traffic bursts without dropping packets. For inline inspection, aim for 95th-percentile processing latency under 5 ms. On high-throughput links, dedicated appliances with FPGAs or ASICs often make more sense. Also, set up a tested bypass path so you can shut off DPI fast if it causes latency spikes or an outage.
Privacy, retention, and reporting controls
DPI can expose credentials, message content, and other sensitive data if you’re careless. That’s why scope matters. Use packet slicing to capture only the first 64–128 bytes of each packet when headers are all you need, and apply BPF filters at the kernel level to drop irrelevant traffic before it reaches the DPI engine. Mask or anonymize PII in logs before anything is written to storage.
For retention, keep full packets for 7 days for near-term troubleshooting, then keep headers only for 90 days for compliance and trend analysis. Encrypt stored PCAP files and document exactly who can access raw captures. In the United States, make sure any DPI process is lawfully authorized before you run it. Unauthorized interception can violate wiretap statutes under 18 U.S.C. § 2511.
When DPI adds value and when it adds overhead
Use DPI when the question sits inside the payload. That includes threat detection, proving compliance with PCI-DSS or HIPAA, and telling apart application classes based on flow shape and packet timing.
Pull back on DPI for routine monitoring when header and session data already answer the question. The storage and CPU cost can get expensive fast. On a 10 Gbps link at 50% utilization, you’re looking at about 5.4 TB of raw packet data per day. At that point, inspecting everything all the time is a tough sell without a tiered plan.
And one more thing: keep a bypass path ready so you can disable DPI right away if it starts adding latency or causes an outage.
If payload visibility drops, use handshake metadata and behavior patterns next.
Checklist 3: Analyze Encrypted and Anomalous Traffic
HTTPS hides payloads, so when you can't see the content, you need to look at the shape of the connection instead. That means inspecting handshake metadata and traffic behavior.
Encrypted traffic inspection checklist
When payloads are hidden, shift from content inspection to handshake metadata and connection behavior.
Full TLS decryption gives you plaintext. But it comes with tradeoffs: more CPU use, key management, and authorization requirements. And for PFS traffic, static RSA keys won't decrypt sessions. In those cases, use pre-master secret logs (SSLKEYLOGFILE).
If full decryption doesn't make sense, TLS metadata analysis still gets you a lot. Check the ClientHello for cipher suite lists, extensions, and JA3/JA4 fingerprints to identify client libraries without touching the payload. This works well for spotting suspicious automated tools or known malware families that rely on default OpenSSL settings. Also review protocol versions. TLS 1.0 and 1.1 should not appear on a modern network. Self-signed certificates or odd certificate subject names also deserve attention, because they can point to command-and-control (C2) activity.
| Approach | Visibility | Privacy Risk | Performance | Best For |
|---|---|---|---|---|
| Full Decryption | Full plaintext payload | High (exposes PII/credentials) | High CPU overhead | Malware forensics |
| TLS Metadata Analysis | Handshake (cipher suites, extensions, JA3/JA4) | Moderate (sees domains) | Low overhead | Threat hunting, application identification |
| Flow-Only Review | IPs, ports, timing, packet sizes | Low (connection patterns only) | Minimal overhead | Capacity planning, bandwidth analysis |
Even when you can't or won't decrypt traffic, packet size, timing, and direction ratios can still tell a pretty clear story. Packet size distribution, inter-arrival times, and direction ratios can separate video streaming from VPN tunnels and interactive shells without exposing any payload data.
If metadata still leaves gaps, move to packet timing and flow shape.
Anomaly and behavioral inspection checklist
Use the packet, session, and TLS signals you've already collected to build a baseline.
Track packets per second, packet size, protocol mix, and retransmission rates during normal traffic. Without that baseline, a traffic spike is just a spike. You won't know if it's expected activity or the start of an attack.
Once you have that reference point, start looking for behavior that stands out. Periodic beacons are a classic malware sign. Repeated handshake failures and odd DNS request volumes can point to tunneling or a host trying to reach a C2 server. And when an alert fires, don't look at it in isolation. Correlate it with header, session, and DPI findings right away. A burst of small, symmetric packets may look suspicious on its own, but a JA4 fingerprint can help show whether it's a valid SSH session or a heartbeat beacon.
Use both methods here: rules catch what you already know, and anomaly models help spot what you don't.
| Feature | Rule-Based Detection | Anomaly-Based Detection |
|---|---|---|
| Mechanism | Signature/pattern matching | Statistical baseline deviation |
| Strengths | Low false positives; specific | Catches zero-days; works without payload visibility |
| Weaknesses | Brittle; easily evaded by minor changes | Higher false positive risk; needs training data |
| Maintenance | Requires constant signature updates | Requires periodic baseline retraining |
| Best For | Known malware, unauthorized protocols | Novel exfiltration, unknown tunneling |
Retrain on a regular schedule as browsers and protocols change. GREASE, HTTP/3, and ECH can chip away at detection accuracy over time. It's also smart to layer detection methods, so one protocol change doesn't leave the whole system blind.
Implementation Checklist and Conclusion
Ongoing maintenance and verification
After you pick an inspection method, keep the capture pipeline in good shape so the data stays trustworthy. That upkeep is what makes packet inspection dependable day after day.
Start by checking capture integrity. Watch capture statistics all the time. Even a 0.5% packet loss rate can hide key evidence during an investigation. Review retention jobs on a regular schedule too: store full packets for 7 days, then keep 128-byte headers for 90 days.
Once capture integrity is steady, move to time sync.
Keep sensor clocks aligned. Match sensor clocks before you compare events. Use hardware-assisted timestamping when it’s available so latency measurements and event timelines stay accurate.
Detection rules need care too. Run regular update cycles with tools like suricata-update so signatures stay current, and automate alert delivery to a centralized logging system or SIEM so nothing slips through during high-volume events. Use Expert Information to flag anomalies, errors, and warnings during review.
When these checks are in place, packet inspection stays accurate instead of turning noisy.
Key takeaways from the packet inspection checklist
Use the lightest inspection method that answers the question. Then keep capture health, time sync, and alert delivery aligned.
FAQs
When should I use DPI instead of header inspection?
Use DPI when you need to inspect the actual content of traffic, not just the headers.
It fits cases like:
- content-level classification
- detection of advanced threats
- enforcement of data leakage policies
- troubleshooting of application-layer issues
In short, DPI makes sense when header inspection alone doesn’t give you enough to work with.
What can I learn from TLS metadata without decryption?
You can still see a lot without decrypting the traffic.
That includes source and destination IP addresses, ports, packet sizes, timing, flow boundaries, TLS handshake metadata like cipher suites and extensions, and some application-layer patterns.
With that data, it's often possible to infer the page that was loaded, the type of application in use, what the user was doing, and which destinations were contacted.
How much packet retention do I need?
Packet retention depends on regulatory requirements, forensic needs, and day-to-day operating limits. The right timeframe changes from one environment to another.
In plain English: there’s no one-size-fits-all retention period.
The goal is to balance cost, compliance, and what your team can realistically store and manage based on your own needs.


![Thumbnail for: Mobile Form Design: 10 Best Practices [2024]](https://assets.seobotai.com/cdn-cgi/image/quality=75,w=1536,h=1024/content-and-marketing.com/67c4fcf86c9ebce918920a43-1740987572622.jpg)