CRM data is a goldmine for improving user experience (UX) design. It moves design decisions from guesswork to informed strategies by showing what users do, why they do it, and where they face challenges. Here's how CRM data makes an impact:
- Personalized Experiences: Tailor interfaces and content based on user behavior, demographics, and preferences.
- Identifying Pain Points: Spot issues like abandoned carts, confusing navigation, or stalled deals.
- Behavioral Insights: Combine quantitative data (e.g., click rates, session durations) with qualitative feedback (e.g., reviews, surveys) to understand user motivations.
- Improving Navigation: Create role-specific layouts and streamline processes to reduce friction.
- Measurable Results: Companies using CRM data for UX design report faster revenue growth, higher retention rates, and better customer satisfaction.
For example, tracking abandoned forms or high bounce rates helps pinpoint problem areas, while personalized navigation and targeted content improve engagement. CRM-backed design isn't just about numbers - it's about understanding the human side of data to create better user experiences.
Creating the best CRM design for end users
sbb-itb-645e3f7
Understanding CRM Data for UX Design
5 Types of CRM Data and Their UX Design Applications
Types of CRM Data
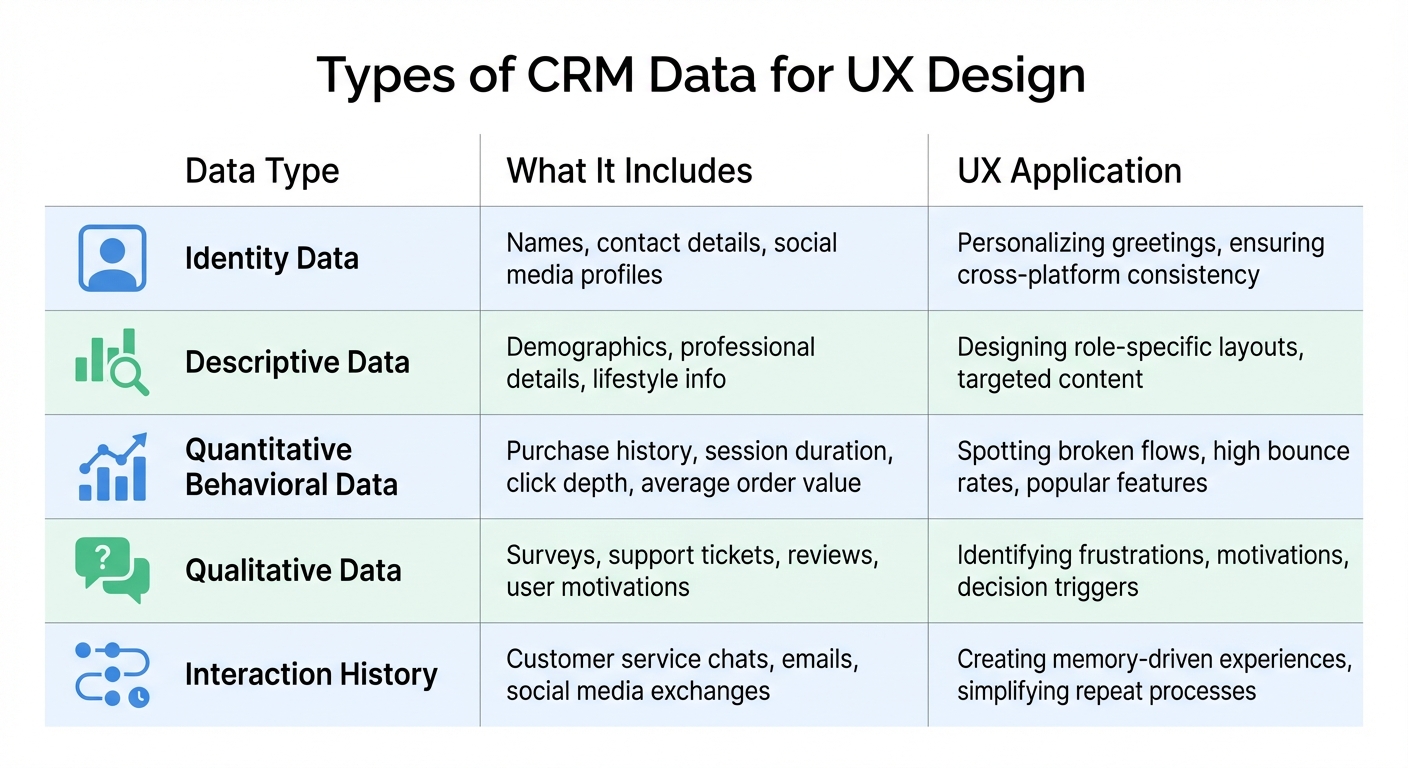
CRM systems organize data into five key categories, each playing a distinct role in improving user experiences. Identity data covers essentials like names, contact details, and social media profiles - helping maintain consistency across platforms. Then there’s descriptive data, which includes demographic and professional details. This type of data allows designers to craft role-specific interfaces and remove unnecessary clutter.
Quantitative behavioral data provides metrics such as purchase history, session duration, click depth, and average order value. These numbers reveal what users are doing - shedding light on popular features and areas where users struggle. On the other hand, qualitative data - gathered from surveys, support tickets, and reviews - dives into the why, uncovering user motivations and frustrations that raw numbers can’t explain. Lastly, interaction history records every customer service chat, email, and social media exchange. This data enables designers to create memory-driven experiences, like simplifying checkout for users who’ve previously reported challenges.
| Data Type | Focus | UX Application |
|---|---|---|
| Quantitative | User actions | Spotting broken flows, high bounce rates, and popular features |
| Qualitative | User motivations | Identifying frustrations, motivations, and decision triggers |
| Identity | Who the user is | Personalizing greetings and ensuring cross-platform consistency |
| Descriptive | User's lifestyle/role | Designing role-specific layouts and targeted content |
By incorporating these data types, designers can make precise tweaks to interfaces, directly addressing user needs.
Benefits of CRM Data for UX
Now that we’ve broken down the types of CRM data, let’s explore how this information enhances UX. These data categories provide a foundation for pinpointing user pain points and refining their experiences using quality content marketing tools.
CRM data moves design decisions from guesswork to informed action. For instance, 81% of consumers say they prefer personalized experiences. CRM data makes this possible by tailoring interfaces to specific user groups. Despite this, only 42% of companies currently use data to guide their design strategies - a missed opportunity. Companies that embrace data-driven design are 5% more productive and 6% more successful than their competitors.
Geoffrey Moore, author and consultant, famously remarked:
"Without big data analytics, companies are blind and deaf, wandering out onto the web like deer on a freeway".
Using CRM data allows designers to identify pain points before they escalate, streamline navigation based on real user behavior, and reduce the cognitive load required to complete tasks. For example, when the City of Toronto implemented CRM-based service updates, they achieved a 17% reduction in service requests and a 34% increase in knowledge base usage. The results speak for themselves: delivering standout customer experiences can make users willing to pay 13% to 18% more for products and services.
Extracting Actionable Insights from CRM Data
Identifying User Pain Points
CRM data can reveal subtle signs of user frustration that might otherwise go unnoticed. For example, tracking abandoned actions - like shopping carts left unpurchased, links users hover over but never click, or forms they begin but don’t complete - can highlight where your interface is falling short. These behaviors are often silent indicators of obstacles in your user experience.
Another telling metric is the navigation vs. search ratio. If users frequently turn to the search bar instead of navigating your site, it suggests your layout may not be intuitive enough. Similarly, high abandonment rates in specific form fields can point to small, fixable issues like unclear formatting instructions - for instance, not specifying how to enter a phone number.
For B2B products, analyzing stalled deals in your CRM pipeline can pinpoint where prospects encounter friction or lack essential information. These bottlenecks can guide improvements to specific stages of the buyer journey. Tools like AI-driven sentiment analysis can take this further by processing data from support tickets, social media, and CRM notes to uncover recurring issues that might otherwise be missed.
By leveraging these insights, you can better understand your users’ pain points and refine their experience.
Behavioral Patterns and Preferences
To design effectively for your users, you need to understand not just what they do, but why they do it. The "Quant/Qual Sandwich" method combines quantitative data with qualitative insights to achieve this balance.
Start by segmenting users based on their behavior rather than just demographics. For example, group them into categories like "Pragmatists", who prioritize efficiency, or "Explorers", who enjoy discovering new features. This approach allows you to tailor your interface to meet specific needs.
Tracking feature engagement is another way to uncover areas for improvement. If a high-value feature has low usage, it may need better visibility or a more accessible design. Retention analysis can also be revealing - identify which features drive long-term loyalty. For instance, if your most dedicated users frequently set reminders, consider redesigning your onboarding process to highlight this feature earlier. Additionally, measuring stickiness - the ratio of daily active users (DAU) to monthly active users (MAU) - can show how well your design encourages regular use.
Listening to customer feedback and acting on it pays off. Companies that do so see 41% higher revenue growth, and customers are 2.4 times more likely to stay loyal when their problems are resolved quickly.
Creating Data-Driven Hypotheses
Once you’ve identified key pain points and behavioral trends, the next step is to turn those insights into actionable hypotheses. These hypotheses should connect specific design changes to expected outcomes. For instance, simplifying your checkout process could reduce cart abandonment rates.
To prioritize your ideas, use the Impact/Feasibility curve. Plot each hypothesis based on its potential impact and ease of implementation. Start with "no-brainer" changes that are both impactful and easy to execute before moving on to more complex "big bets". Empathy maps - visual tools capturing what users say, think, feel, and do - can help ensure your hypotheses address real user needs rather than theoretical issues.
Monitoring task success rates is another way to pinpoint trouble spots. If users need multiple attempts to complete a task, it’s a clear sign your design is causing unnecessary frustration. By aligning your hypotheses with these metrics, you can make informed design decisions that truly enhance the user experience.
As Dipan Patel, Former Principal Solutions Consultant at Amplitude, puts it:
"UX analytics provides the data and insights that inform effective UX design experiments".
The stakes for ignoring a data-driven approach are high. Take Snapchat’s 2018 redesign, which was based on assumptions rather than user data - it led to a $1.3 billion drop in the company’s market value. On the flip side, Etsy’s focus on data-driven design increased buyer conversion rates by over 10%.
Personalizing UX with CRM Data
Dynamic Content and Interfaces
Leverage CRM data to transform your homepage into a tailored experience for every visitor. By using insights from past interactions - like behavioral patterns, psychographics, and transaction history - you can go beyond surface-level demographics to craft personalized content. For example, rule-based personalization allows you to combine attributes such as location, purchase history, and event participation (like webinars) to display specific images, headlines, or text that resonate with individual users.
Picture this: new buyers are greeted with product launch highlights, bargain hunters see sale banners, and meticulous researchers find detailed modules like FAQs or comparison guides. This level of customization ensures every visitor feels understood.
Generative AI takes this a step further. By analyzing CRM data, such as browsing history and past purchases, it can automatically create personalized landing pages or hyper-targeted emails using AI-based copywriting. Features like Cross-Object Merge Fields allow you to insert contextual details - like the status of a service case or a recently attended webinar - directly into user-facing content. This makes interactions more relevant and meaningful.
The stakes couldn’t be higher. A staggering 80% of customers believe that the experience a company provides is as crucial as the products or services themselves. Yet, only 32% of marketers feel fully confident in their ability to use customer data effectively to create personalized experiences. Claudia Michon, Director of Product Marketing at Salesforce, underscores this point:
"Content is the conversation you have with customers."
By aligning your content and interfaces with user behavior, you can significantly improve satisfaction and boost conversion rates.
Customized Navigation and Features
Personalized navigation builds on dynamic content to refine the user journey even further. CRM data helps you design a flexible navigation system that adapts to user needs. By identifying pain points - like abandoned carts or confusing checkout processes - you can streamline experiences for specific groups. For instance, if a user left due to a clunky checkout, simplifying that flow or removing distractions when they return can make all the difference.
Take Single-Minded Shoppers as an example. These users repeatedly browse a specific category, so offering tailored navigation shortcuts or dynamic promotions can save them time and keep them engaged. Similarly, if someone interacts with a chatbot about a product but doesn’t complete a purchase, highlighting that product on their next visit can reignite their interest.
For more complex systems, role-based design is key. By displaying only the most relevant options for each user, you reduce cognitive load and make navigation more intuitive.
Amy Baker, a Site Maintenance Expert, captures the essence of this strategy:
"To use CRM data to personalize your website's user journey is to admit that user behavior isn't random but interpretable."
When prioritizing personalized features, focus on balancing implementation effort with potential ROI. For instance, integrating a CRM with your website could deliver measurable benefits. Imagine spending $800 on integration costs and generating 100 new leads with a 10% conversion rate at $500 per sale - that’s a 525% ROI. Seamless CRM-CMS integration ensures ongoing personalization, making every interaction more engaging and effective.
Implementing and Measuring CRM-Informed UX Changes
Integrating CRM Data into Design Processes
To bring CRM data into your design workflow, use APIs for seamless data exchange between your CRM and design tools. Middleware solutions, like iPaaS, can help keep systems scalable and independent, while event-driven triggers - such as "Deal Won" - can automatically update user interfaces or unlock premium features.
A helpful approach is the Quantitative/Qualitative Sandwich method. Start by using quantitative data to segment your audience. Follow this up with qualitative research to better understand behaviors and motivations. Finally, validate your findings with quantitative tests to gather feedback. For example, you might begin with a minimum viable product (MVP) targeting a specific user need, like improving the search interface for a support team.
Once your integration is in place, confirm its effectiveness by testing and analyzing your A/B test results in controlled environments.
A/B Testing and Iterative Improvements
With CRM data integrated, A/B testing becomes a powerful tool to refine your designs. Always base your tests on objective data rather than assumptions. Focus on one variable at a time - such as button color, form layout, or navigation style - to isolate its impact.
Take inspiration from Arenaturist.com, a hotel booking site that tested a vertical form against a horizontal one in 2024. Switching to the vertical layout led to a 52% increase in form submissions. Keep in mind, though, that only one in seven A/B tests typically results in a winning variation. To ensure reliable results, aim for statistical significance (around 95%) and run tests for 10 to 14 days. Resist the temptation to end a test early; stick to your planned sample size and timeframe.
While optimizing for specific goals, don’t lose sight of the bigger picture. For example, a design change might boost conversion rates but harm retention. To avoid such trade-offs, track guardrail metrics alongside your primary goals. Liz Hayes, a CRM Specialist at MESHKI, underscores the importance of actionable data:
"I prefer to focus on click rates over open rates... A click rate is actionable."
Tracking UX Success Metrics
Measuring UX success involves understanding both user behavior and sentiment. Google’s HEART framework - Happiness, Engagement, Adoption, Retention, and Task Success - offers a solid foundation for evaluation. Pair this with the Goals-Signals-Metrics process: start with your high-level goals, identify behavioral signals that reflect success, and translate those signals into measurable metrics. For instance, if your goal is to streamline the checkout process, track metrics like reduced cart abandonment rates and faster purchase completion times.
Data-driven design can deliver impressive results. For example, Etsy boosted buyer conversion rates by over 10%, McAfee slashed support costs by 90% by addressing usability issues, and user-informed redesigns have demonstrated a fourfold return on investment.
Make your data more actionable by transforming raw counts into averages or percentages. For instance, track the average time users spend on your platform each day. Pay attention to the balance between navigation and search usage - if users rely too heavily on search, it might signal that your navigation isn’t intuitive. Another valuable metric is product "stickiness", calculated by dividing Daily Active Users by Monthly Active Users.
Real-time behavioral data, such as email clicks, web analytics, and social media engagement, provides a clear window into user actions. These insights often reveal what users do, rather than what they claim they’ll do. By continuously monitoring these metrics, iterating on your findings, and aligning your CRM insights with UX improvements, you’ll keep your design process both informed and effective. Remember, improving UX is a continuous journey, not a one-time task.
Conclusion
CRM data has revolutionized UX design by turning educated guesses into informed strategies. With the unified customer insights a CRM provides, you can design experiences that truly reflect user behaviors, preferences, and challenges. This proactive approach allows you to address potential friction points before users even bring them up.
Here's why this matters: companies excelling in customer experience outperform their competitors by nearly 80%, and customers are willing to spend 13%–18% more for a better experience. Yet, despite the clear advantages, CRM adoption rates remain surprisingly low. This gap presents a huge opportunity for businesses ready to blend data with design.
Austin Anderson from Salesforce sums it up perfectly:
"Behind every data point, there is a human being. Our job is to translate those numbers to create connections with customers."
This perspective highlights the real-world impact of data-driven UX design. From uncovering insights and resolving pain points to tailoring interfaces and tracking outcomes, CRM-backed design fosters a continuous feedback loop. This ensures your designs stay relevant to both user expectations and business objectives.
But remember, using CRM data isn’t a one-and-done deal. It’s an ongoing process that evolves with your users and keeps your designs in sync with their changing needs and your business goals. The result? Smarter decisions and measurable success.
FAQs
How can CRM data help uncover user pain points in UX design?
CRM data plays a crucial role in understanding user behavior by bringing together details like user interactions, support tickets, and usage trends. This consolidated view helps pinpoint common frustrations, inefficiencies, or workflow obstacles, giving designers a clearer picture of what users struggle with.
With this information, UX teams can focus on making changes that directly tackle these pain points, resulting in smoother and more enjoyable user experiences. For instance, if a particular feature generates a high volume of support tickets, it might indicate a need for improved usability or clearer guidance.
What types of CRM data are most useful for improving UX design?
CRM data is a game-changer when it comes to improving UX design. It provides a treasure trove of insights into user behavior and preferences, helping designers craft experiences that truly resonate. Here are the key types of CRM data that make a difference:
- Identity data: This includes basic details like names, contact information, and user profiles. It’s the foundation for tailoring experiences to individual users.
- Interaction data: Logs of calls, emails, and website visits showcase how users interact with your brand, offering clues about their engagement patterns.
- Transaction data: Purchase histories and deal records reveal what customers need and their buying habits, helping refine design strategies.
- Behavioral data: This covers preferences, usage trends, and loyalty signals, providing a roadmap for creating designs that align with user expectations.
By diving into these data points, UX designers can build more intuitive, user-focused experiences that meet customer needs and enhance satisfaction.
How can businesses evaluate the impact of CRM data on UX design improvements?
Businesses can gauge the impact of CRM-driven UX updates by diving into key metrics like conversion rates, task completion times, bounce rates, churn rates, and revenue growth. These numbers tell part of the story, but pairing them with qualitative insights - such as customer surveys and user feedback - offers a fuller picture of how design changes are resonating with users.
For reliable results, it’s essential to track these metrics consistently over time and evaluate how well the updates align with user expectations and needs. This not only confirms whether the changes are working but also uncovers opportunities to make the experience even better.